
A standalone battery storage system is not a large battery. It is a revenue asset, and the capacity you build should be the capacity the revenue justifies.
That distinction is where most projects in the 50 kW to 1 MW band fail. The load is measured, a battery is sized at a familiar fraction of it — 20%, 30%, one hour, two hours — and the business case is written afterwards. The result is a system that is technically competent and financially mediocre: it shifts some energy, it trims some peaks, it does neither well enough to pay for itself inside the warranty period.
This guide works the problem in the opposite order. It starts from the three revenue streams that exist for a standalone battery at this scale, states what each one requires and what each one pays, and then sizes the battery to the combination the site can actually capture. It ends with a 500 kW / 1 MWh example on a two-rate industrial tariff, carried through to a ten-year cash flow.
Three revenue streams exist in this band — and only three
Above 1 MW, a battery can trade in wholesale energy markets, bid into capacity auctions and provide system inertia. Below 50 kW, it is a backup box. Between the two, a standalone battery earns from exactly three sources, and every credible business case at this scale is a combination of them.
| Revenue stream | What the battery is paid for | Time scale | Annual potential at 500 kW / 1 MWh |
|---|---|---|---|
| Demand charge reduction | Reducing the monthly peak demand | Monthly billing peak | USD 60,000–90,000 |
| Energy arbitrage | Moving energy from cheap hours to expensive hours | Daily | USD 15,000–25,000 |
| Contracted ancillary services | Availability or response under a contract | Contract term | USD 5,000–25,000, contract-dependent |
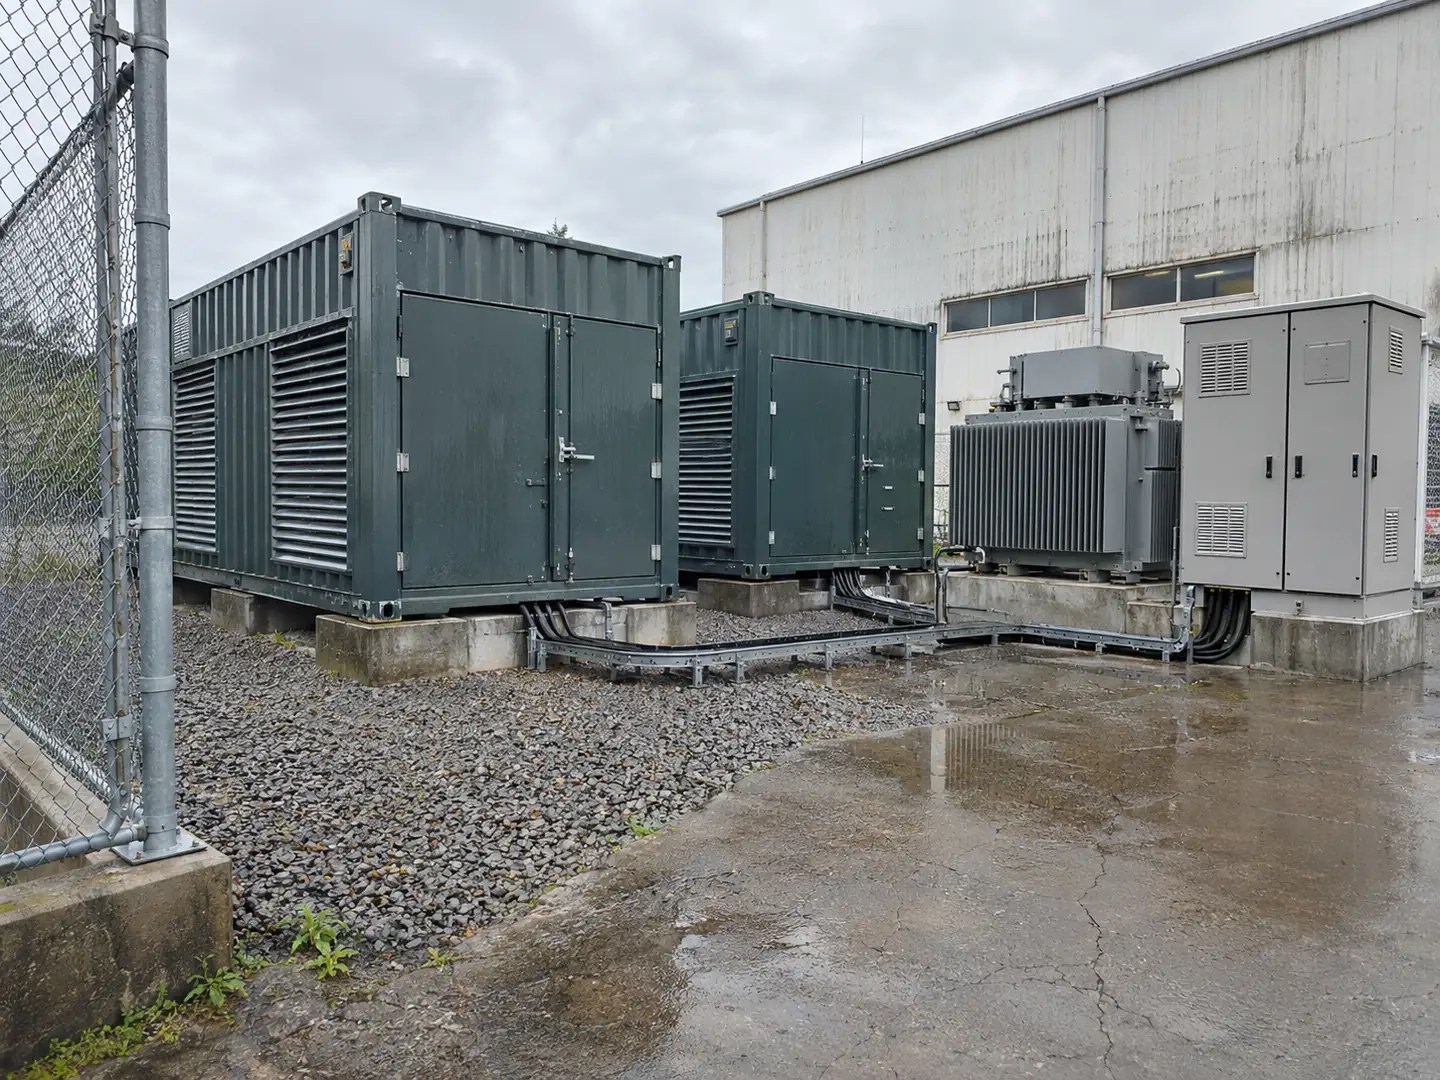
The ranges are indicative and move with the local tariff, but the ordering is stable across most commercial and industrial markets. Demand charges dominate because they are calculated on power rather than energy, and a battery is a power device. A 500 kW battery that shaves 500 kW from a monthly peak earns its value once a month, not once a day, and at a rate per kilowatt that is typically ten to thirty times the energy tariff.
The third stream is real but conditional. Without a contract, a battery cannot be paid for ancillary services, and a 500 kW system is usually too small to contract directly. Treat it as upside, not as the foundation of the case.
Peak shaving pays first: demand charges are the largest line item
A demand charge is a monthly fee applied to the highest average power the site draws over a defined interval, usually 15 or 30 minutes. It exists because the network and the generator must be sized for the worst interval, not the average one, and it is billed whether that interval occurs once or thirty times.
The arithmetic is unforgiving. A site with a 1,200 kW peak and a USD 12/kW monthly demand charge pays USD 14,400 every month, or USD 172,800 a year, for capacity it uses for a few minutes. If a 500 kW battery is dispatched to cap the site’s draw at 700 kW, the demand charge falls to USD 8,400 and the saving is USD 6,000 a month.
| Peak demand without battery | Demand charge at USD 12/kW | With 500 kW battery | Saving per month | Saving per year |
|---|---|---|---|---|
| 900 kW | USD 10,800 | 500 kW cap | USD 4,800 | USD 57,600 |
| 1,200 kW | USD 14,400 | 700 kW cap | USD 6,000 | USD 72,000 |
| 1,600 kW | USD 19,200 | 1,100 kW cap | USD 6,000 | USD 72,000 |
Two features of demand charges make them unusually well suited to a battery. The first is that the peak is a power event, not an energy event: capping 1,200 kW at 700 kW for 30 minutes requires 250 kWh of energy, which a 1 MWh battery can supply several times over in one day. The second is that the peak is predictable. It follows the production schedule, the weather and the shift pattern, and after a year of interval data the site’s peak hours are known to within an hour.
The failure mode is equally well defined. A demand charge is set by the single worst interval in the month, and that interval is often not the one the EMS expects. A cold snap that starts every compressor at once, a maintenance crew running a welder during a shift change, a cloud edge that cuts a solar array’s output for four minutes — each can produce a peak that arrives when the battery was scheduled to be empty. A peak-shaving controller has to be reactive, not just scheduled.
The kW rating of the battery is set by the peak it must shave, not by the site’s average load. This is the first place where sizing to the load produces the wrong answer.
Arbitrage works only where the spread exceeds the cost of the round trip
Energy arbitrage is the simple idea that a battery buys power when it is cheap and sells it when it is expensive. On a commercial site the buying price is the off-peak tariff and the selling price is the peak tariff, and the difference has to cover the losses.
A lithium iron phosphate system returns 85 to 90% of the energy it takes in, for the round trip from AC to DC, through the cells, and back to AC. If the off-peak rate is USD 0.07/kWh and the round-trip efficiency is 88%, every kilowatt-hour delivered at peak cost USD 0.0795 to store. The arbitrage margin per delivered kilowatt-hour is therefore:
margin = peak price × 0.88 − off-peak price
| Off-peak price | Peak price | Spread | Margin per kWh delivered | Verdict |
|---|---|---|---|---|
| USD 0.07 | USD 0.10 | USD 0.03 | USD 0.018 | Marginal; 15-year payback on storage alone |
| USD 0.07 | USD 0.14 | USD 0.07 | USD 0.053 | Workable |
| USD 0.07 | USD 0.18 | USD 0.11 | USD 0.088 | Strong |
| USD 0.10 | USD 0.25 | USD 0.15 | USD 0.120 | Very strong |
The rule of thumb that follows is that arbitrage is worth building only where the peak tariff is at least two and a half times the off-peak tariff. Below that ratio, the battery is better justified by demand charges alone, and the energy throughput is a secondary benefit.
There is a second constraint that the table hides: the number of hours the peak tariff covers. A tariff with a four-hour peak window allows one full cycle per day. A tariff with a two-hour window allows only 900 kWh of discharge from a 1 MWh battery, because the window ends before the battery is empty. The revenue is proportional to the energy the window can absorb, not to the battery’s capacity.
Where the peak window is short and the demand charge is high — the common combination — the battery should be sized for power first and energy second. A 500 kW / 1 MWh unit discharges for two hours at full power; a 500 kW / 500 kWh unit discharges for one hour and does the demand job just as well if the peak lasts less than an hour.
Ancillary services require a contract, not a battery
Frequency response, spinning reserve and voltage support are worth real money in markets that pay for them, and a battery is technically excellent at all three. The obstacle is not technical.
Ancillary service revenue requires four things that a commercial site rarely has: registration as a market participant or a contract with an aggregator, a telemetry link to the system operator, a dispatch interface the operator can call, and a metering and settlement arrangement that the operator accepts. In most markets, a 500 kW battery does not qualify on its own and reaches the market through an aggregator who pools many small units.
When it works, the revenue is a capacity payment — a rate per MW per year for being available — rather than an energy payment, and availability is measured in response time and reliability, not in kilowatt-hours. The battery must hold a defined state of charge and respond within seconds, which conflicts directly with the daily cycling that arbitrage and demand charges require.
The honest treatment in a business case is to model the system without ancillary revenue, then note the upside and the conditions. A project that only works with ancillary revenue is a project waiting for a contract that may never be signed.
The dispatch conflict: two revenue streams cannot share one window
This is the part of standalone storage economics that spreadsheets miss, and it is the reason two batteries with identical hardware can earn 40% different revenue.
Demand charge reduction and energy arbitrage both want the battery’s energy at the same time — the expensive hours. But they want it for different reasons, and those reasons impose different constraints.
Demand reduction needs the battery to be ready whenever the site’s peak might occur, which is unknown in advance and varies by month. Arbitrage needs the battery to be full at the start of the peak window and empty at the end, every day, regardless of whether the site actually peaks.
The conflict shows up in three ways:
State of charge held in reserve. A demand controller that keeps 30% of the battery in reserve for an unexpected peak has 30% less energy for arbitrage. The reserve is not waste — it is insurance against a billing penalty — but it has a cost, and the cost has to be in the model.
Discharge timing. An arbitrage schedule discharges as early as the peak tariff allows, because the price is highest then. A demand controller waits for the peak. If the site’s peak arrives at 16:00 and the battery was emptied by 10:00 on a schedule that discharged at the first opportunity, the demand charge is not reduced at all.
Cycle counting. Every discharge is a cycle against the warranty. A battery used for aggressive arbitrage might run 350 cycles a year; a battery used only for demand reduction might run 60 partial cycles. The first reaches its cycle limit years before the second, and the warranty terms usually define a cycle in a way that makes partial cycles count.

The resolution is to schedule demand reduction first and arbitrage second, and to give the demand function a protected reserve. In most commercial cases the demand charge is worth more per kilowatt-hour of battery energy than the arbitrage margin, so the reserve is economically correct even though it reduces throughput. The EMS should enforce that priority automatically, not leave it to an operator.
Behind-the-meter or front-of-meter changes the whole design
The same battery earns very differently depending on which side of the customer meter it sits.
| Behind the meter | Front of meter | |
|---|---|---|
| Connection | On the customer’s side of the utility meter | Directly to the distribution network |
| Revenue source | Avoided demand charges and energy costs | Market sales and contracted services |
| Approval needed | Building permit, utility notification | Interconnection agreement, market registration |
| Metering | Customer’s own interval data | Utility revenue-grade metering and telemetry |
| Revenue certainty | High, tied to a known tariff | Market-dependent |
| Typical scale in this band | Most projects | Rare below 1 MW |
A behind-the-meter battery is paid in avoided cost, which is known in advance and does not require selling anything to anyone. A front-of-meter battery is paid in market revenue, which requires the approvals listed above and carries price risk. At 50 kW to 1 MW, the behind-the-meter model is the one that almost always works, because the demand charge is large relative to the market revenue the same battery could earn and the approval path is shorter.
Some markets allow a hybrid arrangement where the battery is behind the meter but participates in an aggregator’s virtual power plant. That combination is attractive when it exists, but it should not be assumed.
Worked example: 500 kW / 1 MWh on a two-rate industrial tariff

The example below uses a real tariff structure and a measured load profile, with all assumptions stated so the arithmetic can be checked.
Site. A factory with a 1,200 kW peak demand, a 700 kW average working load, a monthly demand charge of USD 12/kW and a two-rate energy tariff of USD 0.18/kWh from 08:00 to 20:00 and USD 0.07/kWh outside those hours. Annual consumption is 4.2 GWh.
Battery. 500 kW / 1,000 kWh lithium iron phosphate, 90% depth of discharge, 88% round-trip efficiency, 6,000-cycle warranty. Usable energy is 900 kWh.
Demand charge reduction. The measured load exceeds 700 kW on roughly 14 days a month, between 10:00 and 16:00. A 500 kW cap reduces the monthly peak from 1,200 kW to 700 kW:
500 kW × USD 12/kW × 12 months = USD 72,000 per year
Arbitrage. The battery has 900 kWh usable and a 12-hour peak window, which it cannot fill with one charge. With a single daily cycle, it delivers 900 kWh at the peak tariff and recharges in the off-peak hours:
900 kWh × (USD 0.18 × 0.88 − USD 0.07) = USD 79.20 per day
Over 250 working days that is USD 19,800 per year. Note that this energy is delivered during the same window that provides the demand reduction, so the two streams stack on the same discharge rather than competing for it.
Combined revenue. USD 72,000 plus USD 19,800 is USD 91,800 at the theoretical maximum. Applying a realistic capture rate of 80% — reflecting days when the peak never arrives, days when the battery is unavailable, and imperfect dispatch — gives:
USD 91,800 × 0.80 = USD 73,400 per year
Capital and payback. A 500 kW / 1 MWh containerised system, installed with its transformer, switchgear and EMS, is indicatively USD 260,000 to 340,000 in most markets. At USD 300,000 and USD 73,400 of annual savings, simple payback is about 4.1 years, before any incentive.
Ten-year view. With capacity degradation at 2% per year and a 1.5% annual tariff escalation, the nominal revenue over ten years is approximately USD 785,000 against the USD 300,000 capital cost. The battery retains about 82% of its original capacity at year ten, which is above the 70% end-of-life threshold in most warranties.
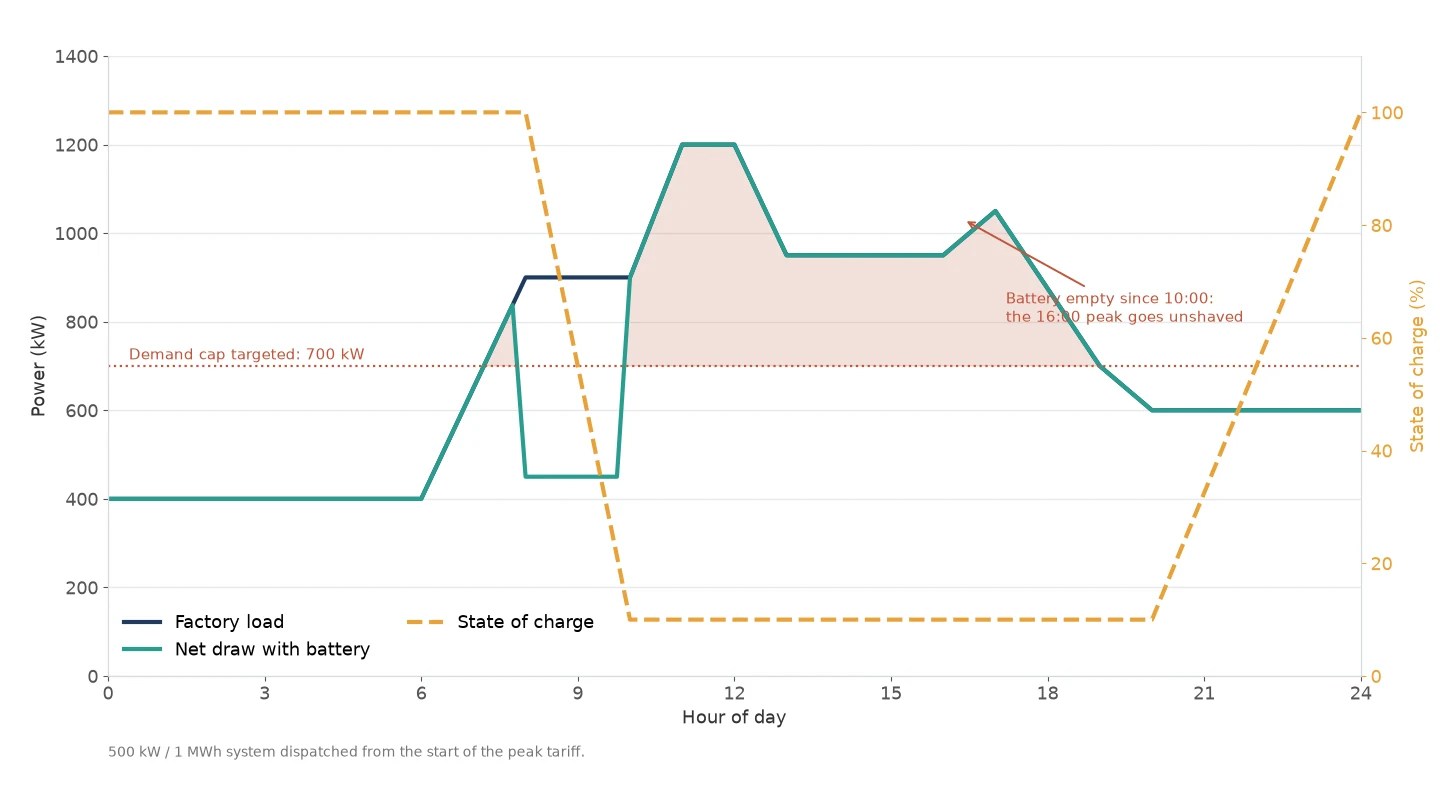
The sensitivities that matter most are the demand charge rate and the peak reduction achieved. A USD 15/kW demand charge raises annual savings to about USD 88,000 and cuts payback to 3.4 years. A peak reduction of 400 kW instead of 500 kW lowers savings to about USD 63,000 and extends payback to 4.8 years.
Degradation: what cycle count does to ten-year revenue
A battery’s revenue is proportional to its usable energy, and its usable energy falls from the first cycle.
A typical lithium iron phosphate system loses 1.5 to 2.5% of capacity per year under daily cycling at moderate temperature, reaching 80% of nameplate around year ten and 70% around year thirteen. A warranty that guarantees 70% at year ten is a warranty that expects this curve, not one that promises something better.
The effect on the business case is smaller than it looks, for two reasons. The first is that the demand charge benefit depends on power, and a battery at 80% capacity still delivers its full 500 kW; it simply runs out of energy sooner. The second is that the energy benefit is a small share of revenue, so a 20% fall in energy value is a 4% fall in total revenue.
| Year | Capacity retention | Demand saving | Arbitrage saving | Total |
|---|---|---|---|---|
| 1 | 100% | USD 72,000 | USD 19,800 | USD 91,800 |
| 5 | 92% | USD 72,000 | USD 18,200 | USD 90,200 |
| 10 | 82% | USD 72,000 | USD 16,200 | USD 88,200 |
The table assumes the demand reduction remains achievable as capacity falls, which is true as long as the peak event lasts less than the battery’s discharge time at reduced capacity. A site whose peak lasts two hours at full capacity will find that a battery at 82% capacity can no longer cover it, and the demand benefit will begin to erode.
Temperature is the other degradation driver, and it is the one under the designer’s control. A battery rated at 25°C delivers less at 40°C, and a container mounted in direct sun without adequate ventilation can run 15°C above ambient. The cooling design is not an accessory; it sets the degradation rate and therefore the revenue.
Size the battery to the revenue, not to the load
The sizing sequence that produces a defensible design runs in five steps, in this order.
Step 1 — Establish the demand charge value. From twelve months of interval data, find the monthly peaks and the rate applied. The revenue available from a 1 kW reduction is the demand charge times twelve.
Step 2 — Set the power rating from the peak you can shave. The battery’s kW should equal the difference between the site’s current peak and the peak it can hold with the battery. Going beyond that difference adds capacity the site cannot use.
Step 3 — Set the energy rating from the peak’s duration and the arbitrage window. A 30-minute peak needs half an hour of energy at the power rating. A four-hour arbitrage window needs four hours, but only if the arbitrage margin justifies the extra cells.
Step 4 — Add the reserve. The demand controller needs headroom for peaks that arrive early or late. A reserve of 20 to 30% of usable energy is typical, and it comes out of the arbitrage allocation.
Step 5 — Test the marginal revenue of one more kWh. If a larger battery increases annual revenue by less than its capital cost divided by the payback target, stop. The optimum is where the marginal kilowatt-hour of battery stops paying for itself.
Containerised battery storage is usually the right format above 250 kWh, because it arrives as a tested unit with its own thermal management and fire suppression. Below that, cabinet systems are cheaper to install. A quote comparison across suppliers is only meaningful once the power and energy ratings have been fixed by the sequence above.
What to ask a supplier before signing
Six questions separate a genuine offer from a data sheet, and each one maps to a term in the contract.
How is cycle life defined? A 6,000-cycle warranty means nothing without its depth of discharge, temperature and end-of-life capacity. Ask for the test conditions, and check that the warranty’s cycle count matches the cycling your revenue model assumes.
What is the round-trip efficiency at the operating point? Efficiency at 50% load and 25°C is not efficiency at the site’s ambient temperature and part-load profile. Ask for the efficiency curve, not a single number.
Is the guarantee for capacity or for power? A capacity guarantee of 70% at year ten protects the arbitrage revenue; it does not protect the demand reduction, which depends on power. The contract should state both.
Does the EMS support prioritized dispatch? The system must be able to protect a demand-reduction reserve while running an arbitrage schedule, and to switch priorities without a firmware change. Ask for the logic in writing.
What are the interconnection and certification requirements? Grid codes vary, and a unit certified for one market may not be accepted in another. The supplier should state the certifications it holds and the tests it can provide.
What is the augmentation path? A system designed to add capacity later costs more per kilowatt-hour at the start but avoids replacing the whole container at year eight. The warranty terms for cycle life and augmentation are where the real differences between suppliers show up.
The revenue decides the design
A standalone battery at 50 kW to 1 MW is a demand-charge machine first and an energy arbitrage device second. Every design decision that follows from that ordering — the power rating, the energy rating, the reserve, the dispatch logic, the degradation allowance — is a financial decision before it is an engineering one.
The project that gets built well is the one whose business case was written before the capacity was chosen. Send the twelve-month interval data and the tariff sheet, and the sizing follows from what the battery can actually earn.
FAQ
– Q: How much does a 500 kW battery storage system cost? A: A 500 kW / 1 MWh containerised system with transformer, switchgear and EMS typically costs USD 260,000 to 340,000 installed, depending on the market and the certification package. The battery itself is about half of that; the balance is power conversion, protection and civil works.
– Q: Can one battery do peak shaving and arbitrage at the same time? A: Yes, on the same discharge, but not with the same energy. The demand function needs a reserve for peaks that arrive unexpectedly, and the reserve reduces the energy available to arbitrage. The correct design protects the reserve and lets arbitrage use what remains.
– Q: How long does a standalone BESS take to pay back? A: Three to six years in most commercial cases where a demand charge above USD 10/kW applies and the battery can reduce the peak by at least 30%. Without a demand charge, payback on arbitrage alone is typically ten to fifteen years.
– Q: Do I need utility approval for a behind-the-meter battery? A: You need a building permit and usually a notification to the utility, but not an interconnection agreement, because the battery does not export. If the battery can export or participate in a market program, the approval path is longer.
– Q: What happens to revenue as the battery degrades? A: Demand charge savings hold almost constant because they depend on power, while arbitrage revenue falls with usable energy. At 80% capacity in year ten, total revenue is typically within 5% of year one, provided the peak event is shorter than the battery’s discharge time.
YURI POWER Engineering Team · November 19, 2026